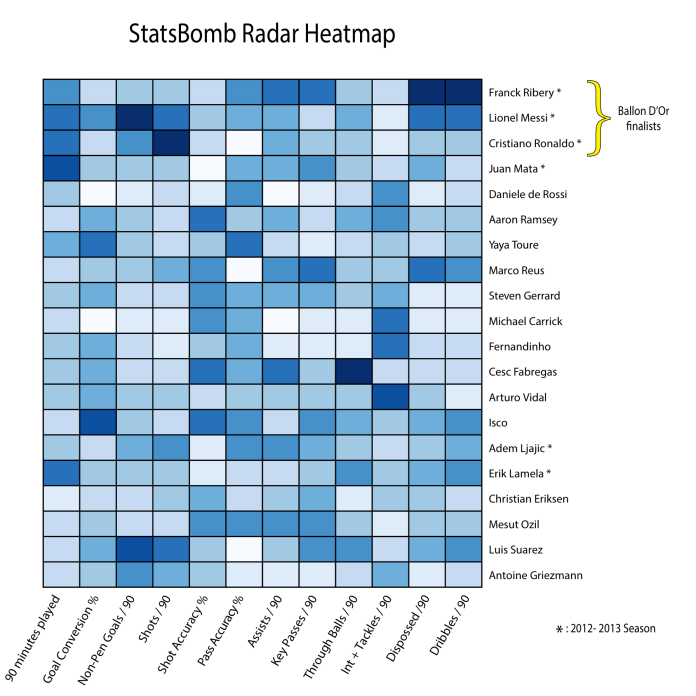
With eight games played so far, the picture for the 2014-2015 season is getting a little more clear. There are some narratives emerging as a result of these games that beg some closer inspection.

Examining Conversion Rates
From most people’s experience playing and watching soccer, certain things seem to be truisms. You have to shoot in order to score. Shorter passes are easier than longer ones. One of these fundamental soccer truths is finishing ability. It’s a near universally held belief that some players are simply better at scoring than others. These players take the same chance that a lesser finisher would sail over the bar and tuck the ball into the far corner instead. However, it’s been proposed by some (see this article, for example, as well as Mike L. Goodman’s extremely thoughtful piece for a discussion of this) that finishing skill may not be as persistent a trait for a given player as intuition leads us to believe. I gathered some data [1] in the hope of exploring this question.
Visualizing Per-90 Stats
Over at StatsBomb, they’ve been putting together some nice radar visualizations as a way to compare stats of individual players. The idea is to conveniently display a bunch of stats for a given player in a way that lets you easily compare players by doing overlays. I think these visualizations are extremely effective for assessing changes in performance, comparing roles, and doing transfer “shopping” for similar types of players. I’ve done an alternate visualization of some of the players charted by StatsBomb, as well as some others added to the mix via Squwka and WhoScored data.
Though my heatmap doesn’t provide the precision of the radar charts for looking at exact numbers in each category, it is quite useful for comparing many players at once (where overlaying radars becomes muddled after four or so players). You can see some key differences highlighted by color change, such as the differing styles of the three finalists for this year’s Ballon D’Or. It’s not a great leap to envision something like this as an interactive graphic that would benefit from some tooltips. Hopefully I’ll get a chance to convert this graphic into something like that when I have a better place to host it (one that handles interactivity).

StatsBomb Article
I’ve written something over at StatsBomb, a website with lots of excellent analytics writing. I’m really excited about the shot charts I’ve been working on for the article, so go give them a look!

Why a Healthy Aguero Could Mean the Title for City
For the last eight matches, Manchester City have been without striker Sergio Aguero, who was suffering from a calf injury. Aguero returned to action against Blackburn in the FA cup on Wednesday, scoring a goal in his first action in a month. City haven’t exactly struggled without Aguero, winning seven and drawing once, but even in a side with as much depth as City, it’s clear that Aguero is irreplaceable.
Charting Shots on Target
In my last post I suggested that it’s important to consider the impact of a team’s shooting positions on the likelihood of that team scoring goals. Just as teams’ attacking and defensive abilities can be assessed by examining the shots they take and allow, an individual player can be evaluated by the kinds of shots they are converting. Where the majority of a player’s shots come from and whether those shots are on target or goals should be good indicators of the scoring threat posed by that player. Given that the quality of an individual player’s shooting is at issue here, it makes sense to look at players who take a lot of shots, and whose value depends on getting on the scoresheet. This means mostly examining strikers and midfielders tasked with a lot of offensive responsibility. I took a swing at presenting this kind of information for Olivier Giroud, Arsenal’s joint leading scorer.

On PDO in Soccer
Luck in Sports
In sports analytics (and statistics in general), a great deal of effort goes into determining which phenomena are random, and which are determined by, or predictive of some other piece of information. When trying to determine the skill level of a team, or their ability in a certain area, you want to know whether statistics in this area are indicative of skill itself, or whether or not they are random, undetermined by a team’s true ability. An example here is turnovers in NFL football. It’s been established that, season to season, the turnover margin of a football team is subject to a great deal of randomness. Thus, teams with lower turnover differentials can be considered to be experiencing “bad luck” and be expected to regress toward average luck in the future (with the reverse holding for high differential teams). In soccer, PDO has been put forth as a stat that is an approximate indicator of a team’s “luck”.

